
CLIENT WORK / GAP REVIEW · MPA-SOM-001
Storm overflows: monitoring gaps and repeat offenders
In one line
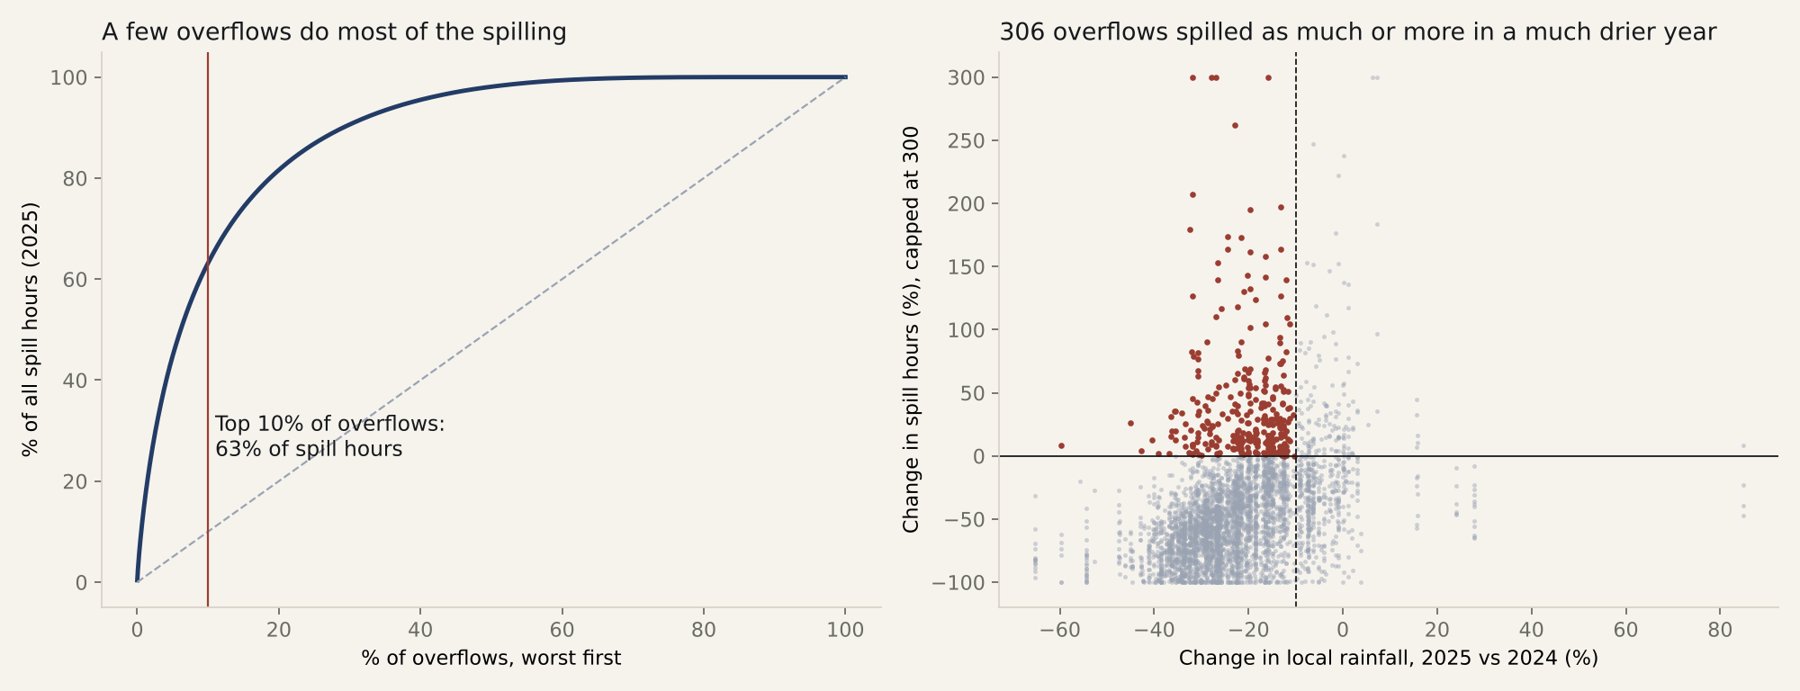
Every storm overflow in England, five years of returns joined up and set against local rainfall. 583 overflows do 40% of the spilling among reliably monitored sites (a third of all spill hours in England), year after year, and 306 spilled as much or more in a much drier year.
The problem
Storm overflows release diluted sewage into rivers and the sea when the network is overwhelmed. Water companies face fines, public anger and multi-billion-pound investment programmes, so the money has to go to the right assets. Three things get in the way: - monitors that do not work, so an overflow reports little because nobody is measuring it - a national total that hides how concentrated the problem is - rain gets the blame for everything, when some overflows spill whether it rains or not
The question
Which overflows have unreliable monitoring? Which ones spill heavily every year? And which ones spill out of proportion to the rain that falls on them?
The data
- The returns: Environment Agency storm overflow annual returns for 2021 to 2025, about 14,300 overflows a year, ten companies.
- Joining the years: each overflow is linked across 2023, 2024 and 2025 using the returns' own IDs; the 2024 file carries the 2023 ID. 14,100 of the 2023 overflows and 14,227 of the 2025 overflows link to 2024.
- Checking the totals: they tie to the Environment Agency's own summary tables (saved in 02 Analysis as EA_summary_check.json). 2024 is exact (14,285 overflows, 3,614,428 spill hours) and so is 2025 (14,303 overflows, 1,878,240 hours). For 2023 the file loads 14,382 overflows against 14,530 in the summary, and the hours agree to 99.9% (3,603,125 against 3,606,170).
- Rainfall: daily totals from 552 Environment Agency rain gauges with a near-complete record, summed by year. Each overflow takes its nearest gauge; the median distance is 7.4 km, and none is more than 15 km away. 12,160 overflows have a gauge in range.
The test rules were written down before the run.
What I found
1. 583 overflows do 40% of the reliably monitored spilling, every year
- 10,084 overflows had monitors working at least 90% of the time in all three years.
- 583 of them (5.8%) were in the worst 10% for spill hours in 2023, 2024 and 2025 alike.
- Those 583 produced 41%, 40% and 45% of that group's spill hours in the three years. In 2025 that was a third of all spill hours in England.
- A typical one spilled 928 hours in 2025, which is 39 days. The median overflow spilled 25 hours.
What it means: a programme aimed at these 583 assets addresses about 40% of the problem among reliably monitored overflows, and a third of it nationally. They are the same assets every year, so this is not bad luck with the weather.
2. 306 overflows spilled as much or more in a much drier year
2025 was much drier than 2024: the median gauge recorded 24% less rain. Spill hours nationally fell by 48%.
- Tested: 3,529 overflows had good monitoring in both years, spilled 100+ hours in 2024, and had at least 10% less local rain in 2025.
- Typical result: spill hours fell by 56%, against 26% less rain.
- The outliers: 306 of them (8.7%) did not fall at all, and 77 of those rose by half or more. Together they spilled 157,204 hours in 2025, 8% of the national total.
What it means: when an overflow keeps spilling with less rain, the likely causes are groundwater getting into the sewers, blockages, pumps or screens failing, or a network simply too small for its catchment. All of these can be fixed, and most cost far less than new storage. These are the first assets an operations team should visit. Most of them sit on the sewer network or at treatment works inlets and storm tanks.
3. Monitoring has improved a lot, but 901 overflows were unreliable in two of the last three years
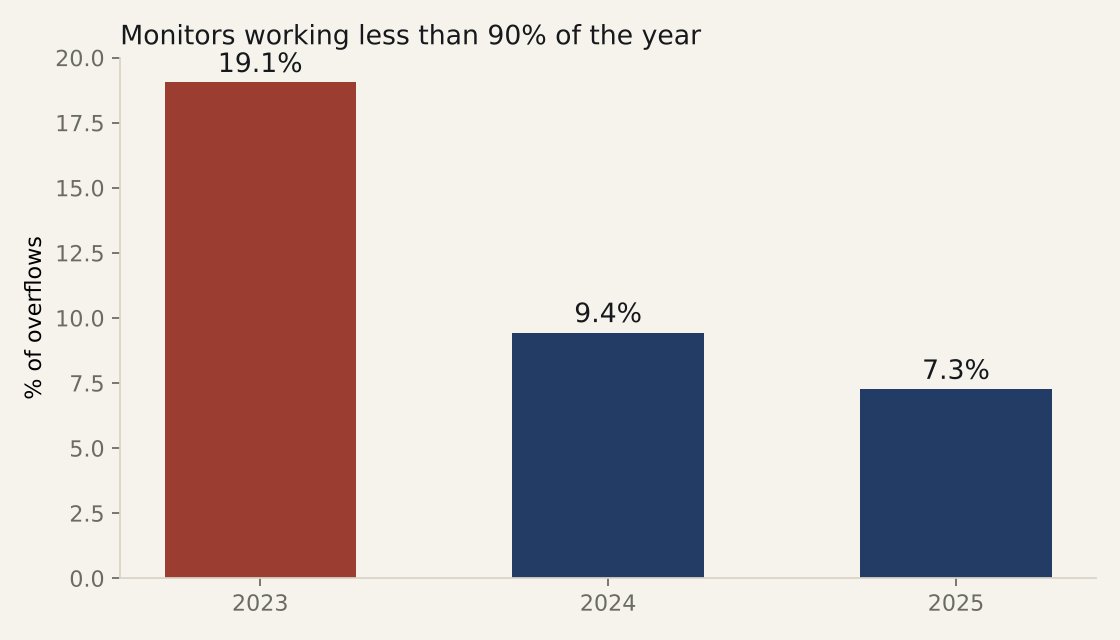
- Monitors working less than 90% of the year: 19.1% of overflows in 2023, 9.4% in 2024, 7.3% in 2025. That is a real improvement.
- Still unreliable: 901 overflows were below 90% in at least two of the three years.
- "Silent": 65 overflows in 2025 had monitors working less than half the year and recorded no spills at all. Their record says nothing either way.
What it means: a low spill count from an overflow with a poor monitor is not good news. It should be treated as unknown until the monitor is fixed.
By company (anonymised)
| Overflows | Spill hours 2025 | Hours per overflow | Repeat offenders | Dry-year spillers | Unreliable 2 of 3 years | |
|---|---|---|---|---|---|---|
| Company A | 2,452 | 200,361 | 82 | 41 | 47 | 94 |
| Company B | 2,270 | 327,453 | 144 | 90 | 78 | 130 |
| Company C | 2,187 | 285,931 | 131 | 90 | 88 | 206 |
| Company D | 1,561 | 123,803 | 79 | 28 | 6 | 148 |
| Company E | 1,442 | 105,806 | 73 | 32 | 14 | 62 |
| Company F | 1,365 | 407,006 | 298 | 143 | 43 | 36 |
| Company G | 1,346 | 190,666 | 142 | 102 | 19 | 18 |
| Company H | 977 | 114,868 | 118 | 0 | 3 | 183 |
| Company I | 581 | 107,822 | 186 | 57 | 7 | 21 |
| Company J | 121 | 14,156 | 117 | 0 | 1 | 3 |
The companies have very different problems: - Company F's problem is a group of heavy, persistent spillers. - Company C and Company B have the most dry-year spillers. - Company H shows no repeat offenders at all, but 183 overflows with unreliable monitoring. Its true position is the least certain of the ten.
What it means for a water company
- Rank the overflows by repeat behaviour, not by last year's total. The 583 persistent offenders are the core of any investment list.
- Send operations teams to the dry-year spillers before designing anything. Failure that rain does not explain is often fixable for a fraction of the cost of storage.
- Treat poor monitoring as unknown, not as low risk. Fix the monitors on the 901 before trusting their totals.
How I would run this for a client
- What you provide: your own event-level monitoring data (spill start and stop times), asset data and your investment plan.
- What you get: a ranked list of the overflows to fix first, with the reason each is on the list (persistent, rain-independent or unmonitored), plus a check of your investment plan against it.
- Event-level data: event times allow rainfall to be matched storm by storm, which makes the dry-weather test much sharper.
- How long: three to four weeks. Fixed fee, agreed when we scope it.
Limits
- Annual totals only. Spills cannot be matched to individual storms from these returns.
- Rainfall is from the nearest gauge, not the whole catchment that drains to the overflow. Gauge totals are used as published, with only the Environment Agency's own quality flags applied.
- A spill is a regulated event under the permit. It is not necessarily a breach.
- The returns use a 12/24-hour counting rule for spills, so spill counts understate the number of separate discharges. Hours are the better measure, and are used throughout.
Hostile self-audit
- "Totals?" They match the regulator's own published summaries exactly for 2024 and 2025. The 2023 gap is stated.
- "Isn't the dry-year test just noise?" It needs 100+ hours in 2024, good monitoring in both years and at least 10% less local rain. Even then, 8.7% failing to fall is not a rounding error. It is still a screening test, and the note calls it that.
- "Naming companies?" Companies are anonymised on the site. Overflow locations are public data and are kept in the working files.
Sources
- Environment Agency, Event Duration Monitoring: storm overflows annual returns 2021 to 2025 (2020 also downloaded), and summary data: https://www.data.gov.uk/dataset/event-duration-monitoring-storm-overflows-annual-returns
- Environment Agency Hydrology API, daily rainfall totals 2023 to 2025: https://environment.data.gov.uk/hydrology/